US flood map — live river levels near you
Every dot is an official NOAA river gauge, colored by its live flood status: blue normal · yellow action stage (approaching flood) · orange minor flooding · red moderate · dark red major flooding. Click any gauge for its stage in feet and the official NOAA forecast link. Polygons are live NWS warnings: blue for river floods, red outline for flash floods. Data refreshes every 15 minutes.
Rivers in flood right now
| Status↓ | Gauge / river↕ | State↕ | Stage (ft)↕ | Official page |
|---|---|---|---|---|
| Loading… | ||||
Gauges at action stage and above. "Stage" is the water level at the gauge in feet — flood thresholds are set per gauge by the NWS.
What the flood categories mean
| Category | What is happening | What to do |
|---|---|---|
| Action | Water is approaching flood stage. | Monitor forecasts; move equipment from low areas. |
| Minor | Low-lying areas and roads near the river flood. | Avoid riverside roads and parks; follow local guidance. |
| Moderate | Some structures and roads inundated. | Evacuations possible near the river — prepare now. |
| Major | Extensive inundation of structures and roads. | Follow evacuation orders immediately. |
Turn Around, Don't Drown. Most flood deaths in the U.S. happen in vehicles. Six inches of moving water can knock an adult down; a foot floats most cars; two feet carry away trucks. If a road is flooded — any road, any depth you cannot verify — turn around.
Flash floods are the fast killer. They come from intense rain in minutes to hours, often far from any river gauge. That is why the red-outlined flash flood warning polygons on this map matter even where every gauge is blue.
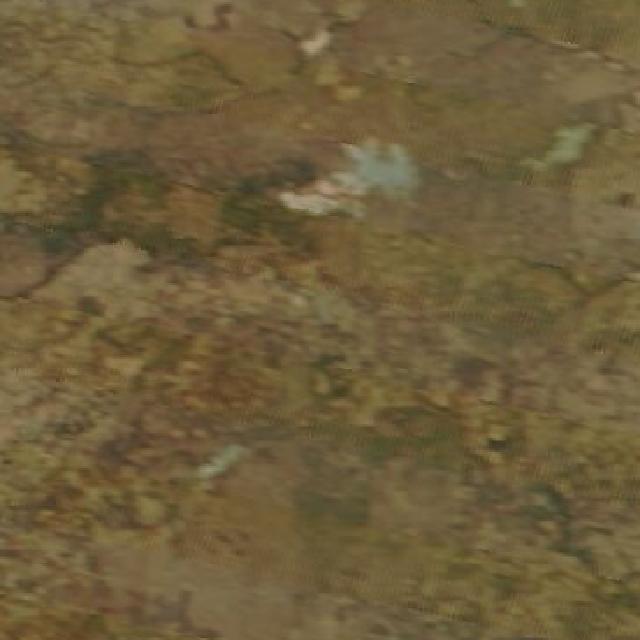
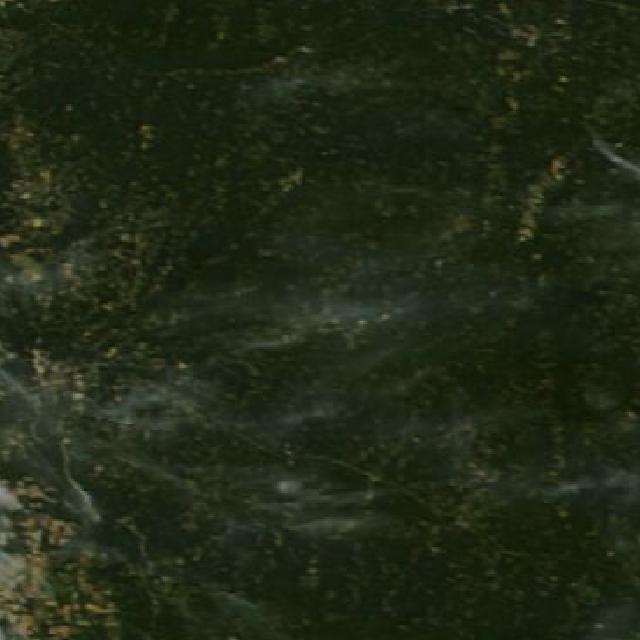
Current floods from space
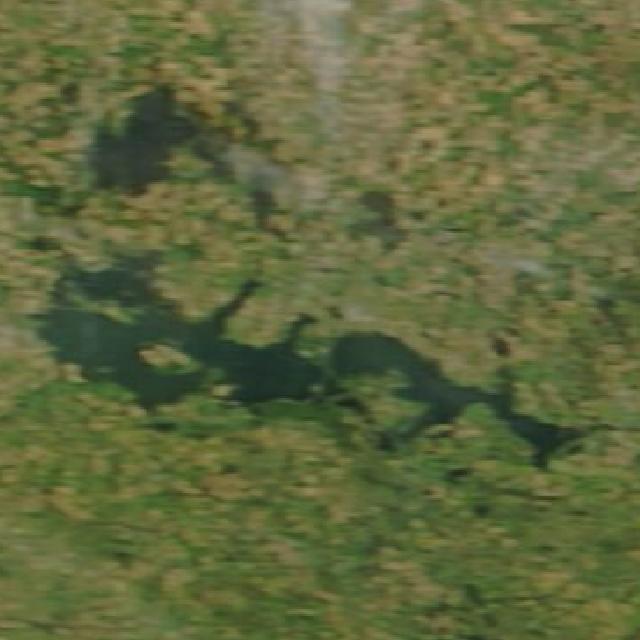
MODIS true-color imagery of the most serious flooding right now — big river floods show up as dark, spreading water where fields should be. We pick the clearest of the last four days for each site.
Frequently asked questions
Is my river flooding right now?
Search your town above or tap 📍 My location: the nearest dots are your rivers. Blue is normal; yellow and above means the NWS flood thresholds are in play. Click a dot for the exact stage and the official NOAA gauge page with the forecast curve.
Why is a gauge missing or gray near me?
Not every river has an official gauge, and some gauges have no NWS flood thresholds defined (we show those without a category). Coverage is best on rivers that historically flood — exactly where it matters most.
How fresh is the data?
We refresh from NOAA every 15 minutes, and the open page re-checks every 5. Gauge readings themselves update every 15–60 minutes depending on the station.
Where does the data come from?
The NOAA National Water Prediction Service gauge network and the National Weather Service alerts API — official U.S. government sources in the public domain. For life-safety decisions always follow your local NWS office and emergency management.