Hurricane archive
Atlantic since 1851 · Pacific since 1949 · every track replayable
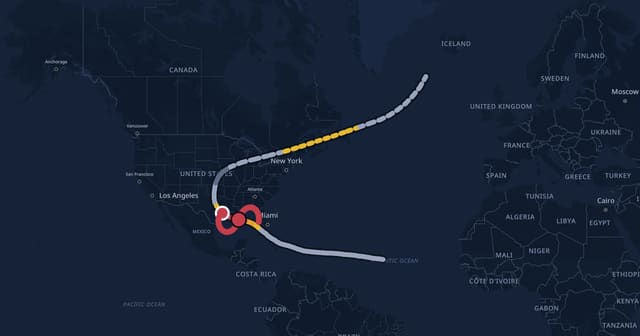
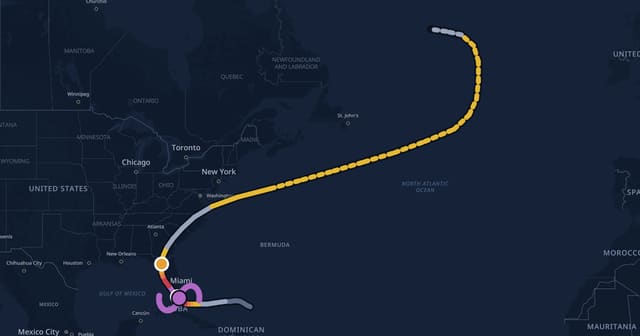
Shown: famous hurricane tracks — click a track to select it, then ▶ Open & replay. To see every storm whose center passed within 100 miles of a place since 1851, use ◎ Hurricanes near me, a city button, or 📍 Pick a point. Privacy: “near me” asks your browser for permission; the position is rounded to about 1 km and used only inside your browser — it is not sent to our server and not stored.
On this day · October 16
Storms active on this date in history
| Year | Storm | Peak | Landfall | |
|---|---|---|---|---|
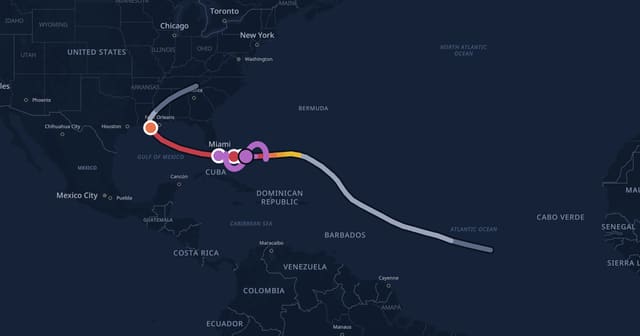
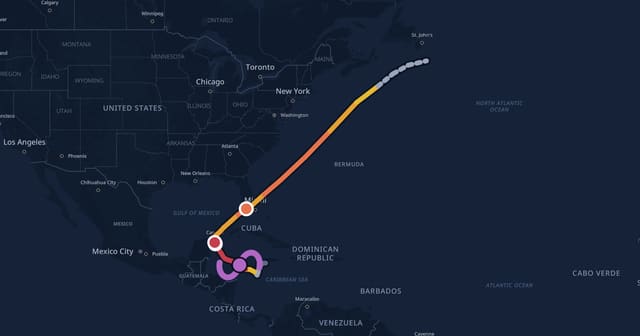
| 2005 | Hurricane Wilma Atlantic | Cat 5 184 mph | Quintana Roo, Mexico, Florida | → |
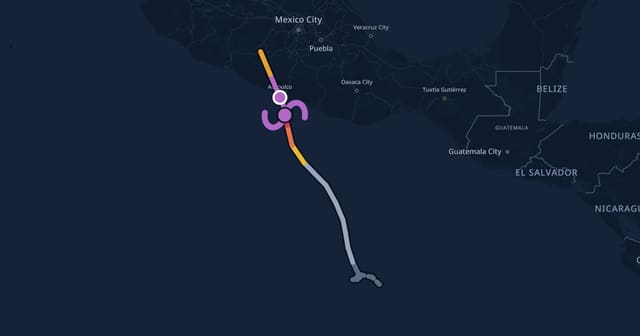
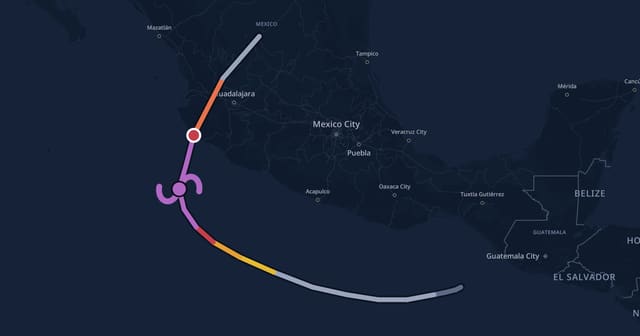
| 2009 | Hurricane Rick Eastern Pacific | Cat 5 178 mph | Sinaloa, Mexico | → |
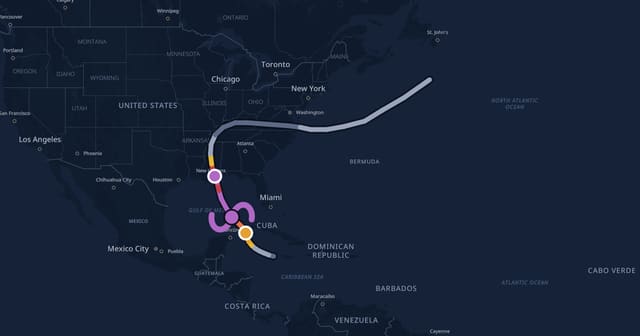
| 1924 | 1924 Cuba Hurricane Atlantic | Cat 5 167 mph | Florida | → |
| 1990 | Hurricane Trudy Eastern Pacific | Cat 4 155 mph | — | → |
| 1910 | 1910 Cuba Hurricane Atlantic | Cat 4 150 mph | Florida | → |
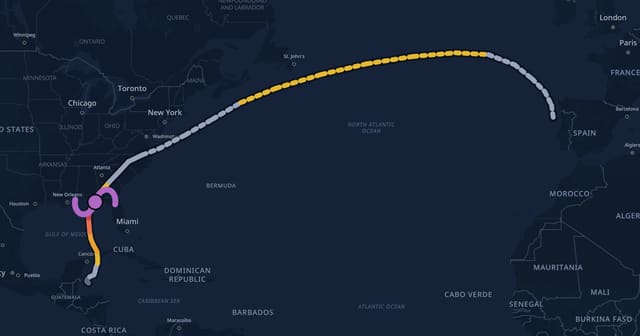
| 1926 | 1926 Havana–Bermuda Hurricane Atlantic | Cat 4 150 mph | — | → |
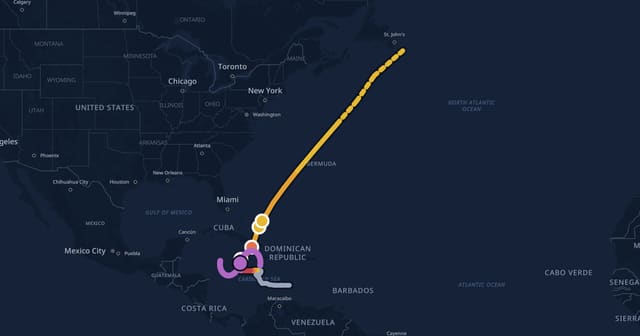
| 1963 | Hurricane Flora Atlantic | Cat 4 150 mph | Haiti, Guantánamo Province, Cuba | → |
| 2015 | Hurricane Olaf Eastern Pacific | Cat 4 150 mph | — | → |
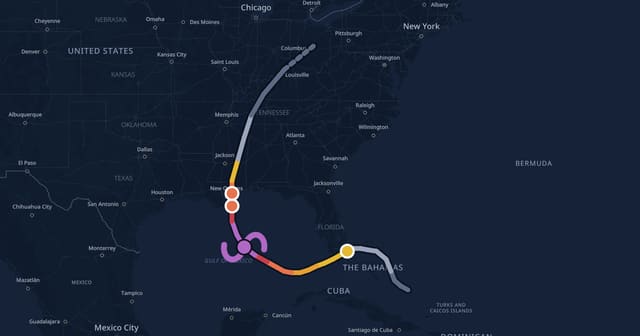
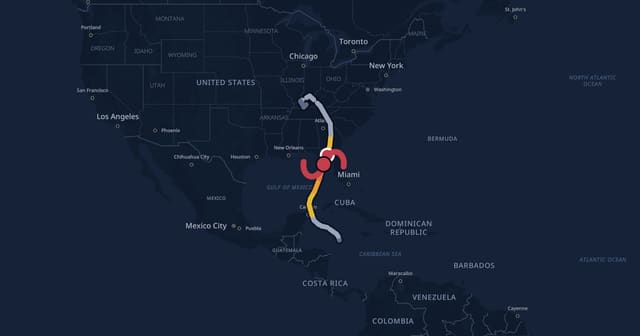
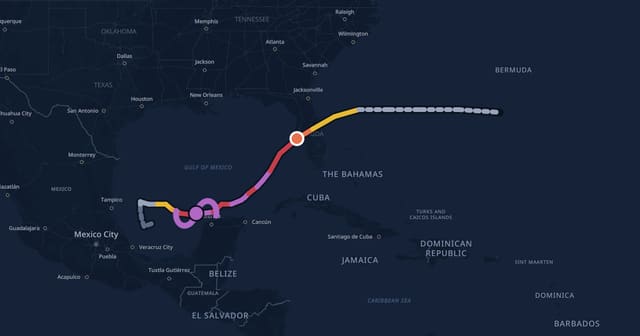
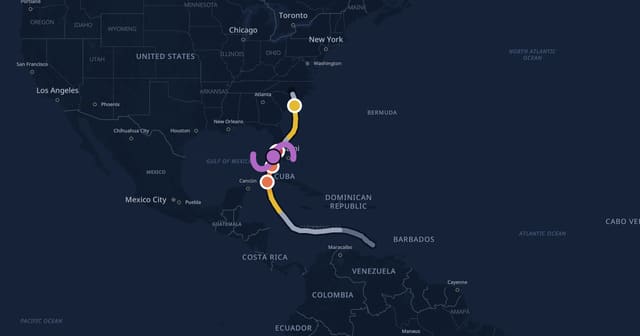
Famous storms
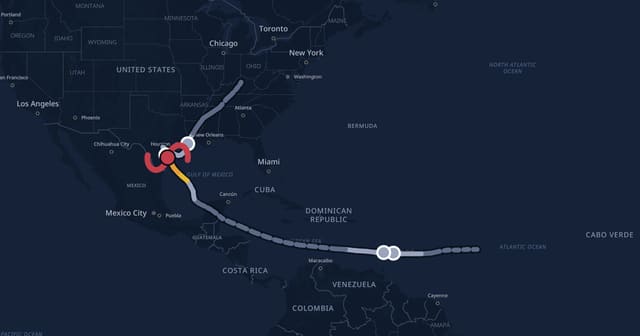
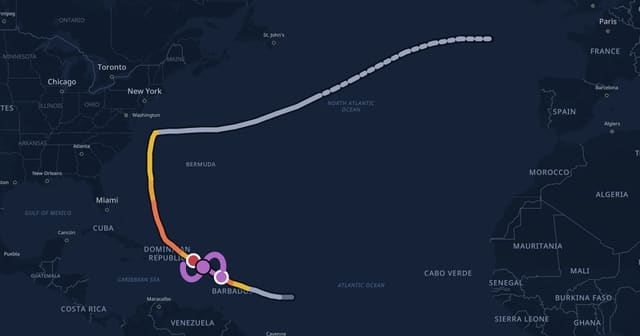
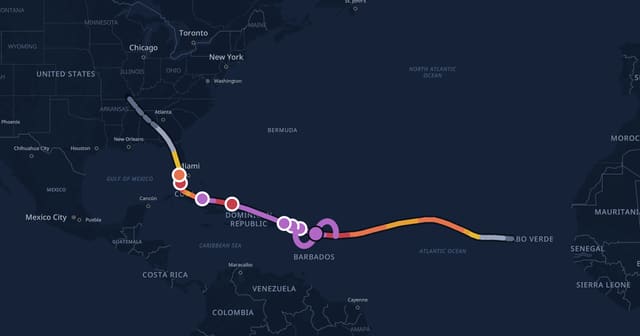
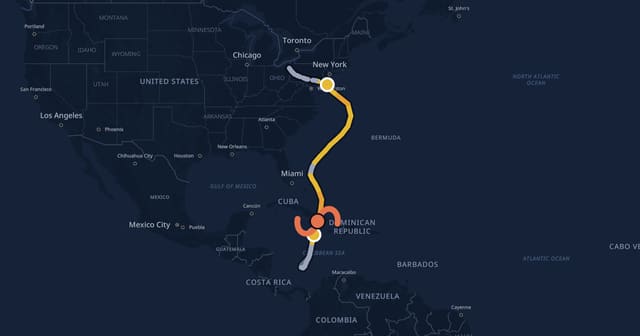
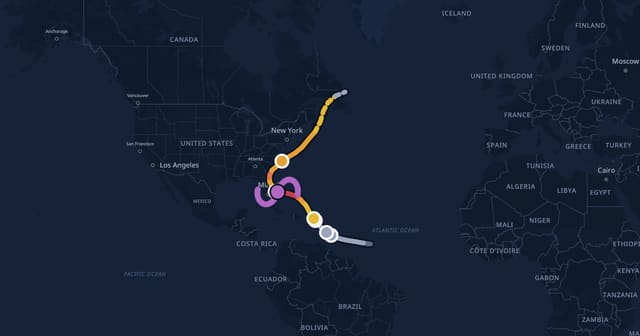
The hurricanes people search for
Seasons
Every season since 1851 color = Atlantic storm energy (ACE)
Records
Strongest, deadliest, costliest
Strongest Atlantic hurricanes lowest pressure
| 1 | Hurricane Wilma 2005 · Atlantic | 882 mb |
| 2 | Hurricane Gilbert 1988 · Atlantic | 888 mb |
| 3 | 1935 Labor Day Hurricane 1935 · Atlantic | 892 mb |
| 4 | Hurricane Melissa 2025 · Atlantic | 892 mb |
| 5 | Hurricane Rita 2005 · Atlantic | 895 mb |
| 6 | Hurricane Milton 2024 · Atlantic | 895 mb |
| 7 | Hurricane Allen 1980 · Atlantic | 899 mb |
| 8 | Hurricane Camille 1969 · Atlantic | 900 mb |
| 9 | Hurricane Katrina 2005 · Atlantic | 902 mb |
| 10 | Hurricane Mitch 1998 · Atlantic | 905 mb |
Strongest Pacific hurricanes lowest pressure
| 1 | Hurricane Patricia 2015 · Eastern Pacific | 872 mb |
| 2 | Hurricane Polo 2026 · Eastern Pacific | 892 mb |
| 3 | Hurricane Ioke 2006 · Central Pacific | 900 mb |
| 4 | Hurricane Linda 1997 · Eastern Pacific | 902 mb |
| 5 | Hurricane Rick 2009 · Eastern Pacific | 906 mb |
| 6 | Hurricane Kenna 2002 · Eastern Pacific | 913 mb |
| 7 | Hurricane Ava 1973 · Eastern Pacific | 915 mb |
| 8 | Hurricane Genevieve 2014 · Eastern Pacific | 918 mb |
| 9 | Hurricane Marie 2014 · Eastern Pacific | 918 mb |
| 10 | Hurricane Odile 2014 · Eastern Pacific | 918 mb |
Most energetic storms ACE
| 1 | Hurricane Ioke 2006 · Central Pacific | 85.3 |
| 2 | 1899 San Ciriaco Hurricane 1899 · Atlantic | 73.6 |
| 3 | Hurricane John 1994 · Eastern Pacific | 70.6 |
| 4 | Hurricane Ivan 2004 · Atlantic | 70.4 |
| 5 | Hurricane Paka 1997 · Central Pacific | 70.2 |
| 6 | Hurricane Irma 2017 · Atlantic | 67.3 |
| 7 | Hurricane Isabel 2003 · Atlantic | 63.3 |
| 8 | Hurricane Fico 1978 · Eastern Pacific | 62.8 |
| 9 | 1932 Cuba Hurricane 1932 · Atlantic | 59.8 |
| 10 | Hurricane Carrie 1957 · Atlantic | 55.8 |
Deadliest per Wikidata
| 1 | Hurricane Mitch 1998 · Atlantic | 19,325 |
| 2 | Hurricane Maria 2017 · Atlantic | 4,645 |
| 3 | 1928 Okeechobee Hurricane 1928 · Atlantic | 4,078 |
| 4 | 1931 Belize Hurricane 1931 · Atlantic | 2,500 |
| 5 | Hurricane Katrina 2005 · Atlantic | 1,833 |
| 6 | Hurricane Stan 2005 · Atlantic | 1,668 |
| 7 | Hurricane Gordon 1994 · Atlantic | 1,152 |
| 8 | Hurricane Georges 1998 · Atlantic | 827 |
| 9 | Hurricane Matthew 2016 · Atlantic | 603 |
| 10 | Hurricane Otis 2023 · Eastern Pacific | 350 |
Costliest nominal USD, Wikidata
| 1 | Hurricane Harvey 2017 · Atlantic | $150 billion |
| 2 | Hurricane Katrina 2005 · Atlantic | $125 billion |
| 3 | Hurricane Ian 2022 · Atlantic | $112 billion |
| 4 | Hurricane Maria 2017 · Atlantic | $92 billion |
| 5 | Hurricane Helene 2024 · Atlantic | $79 billion |
| 6 | Hurricane Irma 2017 · Atlantic | $77 billion |
| 7 | Hurricane Sandy 2012 · Atlantic | $69 billion |
| 8 | Hurricane Ike 2008 · Atlantic | $38 billion |
| 9 | Hurricane Milton 2024 · Atlantic | $34 billion |
| 10 | Hurricane Matthew 2016 · Atlantic | $15 billion |
Most active Atlantic seasons ACE
| 1 | 1933 season 20 storms · 12 hurricanes | 259 |
| 2 | 2005 season 29 storms · 15 hurricanes | 250 |
| 3 | 1893 season 12 storms · 10 hurricanes | 231 |
| 4 | 1926 season 11 storms · 8 hurricanes | 230 |
| 5 | 1995 season 19 storms · 11 hurricanes | 228 |
| 6 | 2004 season 15 storms · 9 hurricanes | 228 |
| 7 | 2017 season 17 storms · 10 hurricanes | 227 |
| 8 | 1950 season 16 storms · 11 hurricanes | 211 |
| 9 | 1961 season 12 storms · 9 hurricanes | 189 |
| 10 | 1998 season 14 storms · 10 hurricanes | 182 |
Records reflect the official best-track data. Before aircraft reconnaissance (1944) and satellites (1966), weak or remote storms were often missed and intensities are estimates — early records undercount.
Questions
Frequently asked questions
What was the strongest Atlantic hurricane ever recorded?
By minimum central pressure, Hurricane Wilma (2005) at 882 mb, with peak winds of 184 mph. By wind speed, the strongest Atlantic storms reached 190 mph.
What was the strongest Eastern Pacific hurricane?
Hurricane Patricia (2015) — 872 mb and 213 mph peak winds.
Which Atlantic hurricane season was the most active?
By accumulated cyclone energy (ACE), 1933 (ACE 259), followed by 2005 and 1893.
How can I see which hurricanes hit my town?
Use the “Hurricanes near you” map on tornadolivemap.com/hurricanes/: click any point (or use your location) to list every storm that passed within 100 miles since 1851, with its strength at the closest point.
What do the hurricane categories mean?
The Saffir–Simpson scale rates sustained winds: Category 1 from 74 mph, 2 from 96, 3 (major) from 111, 4 from 130 and 5 from 157 mph. Tropical storms are 39–73 mph. Most hurricane deaths, however, come from storm surge and inland flooding, not wind.
Where does this data come from?
From HURDAT2, the NOAA National Hurricane Center’s official post-season “best track” database, which is in the public domain. The current season comes from NHC’s operational best track and is marked preliminary until the final reanalysis. Every storm page offers the track as a CSV download.
This site was built by Digital Dynamics Kft.
We build live, data-driven sites like this one
This archive is our own work, built from openly available data — the NOAA best-track records, the replay engine, the wind-field rendering and the map tiles served from our own servers in the European Union. If your business generates data — measurements, machines, orders, customers — we are happy to turn it into a clear, interactive interface.
But this is not all we build:
- online shops and websites, with a design of your own
- SaaS products and ERP systems
- mobile apps for Android and iPhone
- data collection, automation and map-based visualization
Or anything else that can be programmed — just get in touch.
See our work → or write: info@digitaldynamics.hu